A Power BI alternative for teams that report straight from their ERP.
Dashboards, printed reports, matrices, and scheduled PDF and Excel deliveries from one tool, read straight from your ERP or SQL Server. No DAX, no gateway, and no license per viewer.
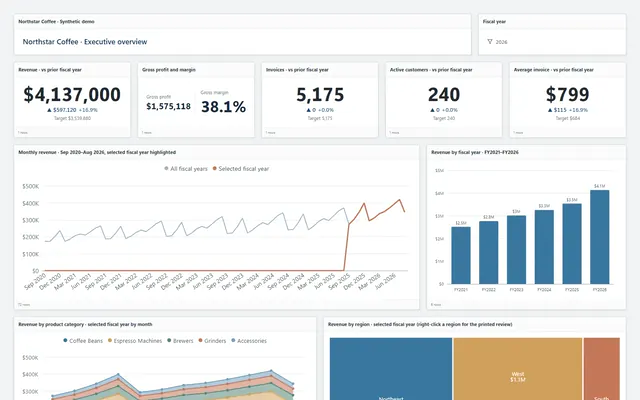
Power BI is a fine analysis tool. It is a heavy way to report on an ERP.
Most companies that go looking for a Power BI alternative are not unhappy with the charts. They are unhappy with everything that has to exist before the first chart: a semantic model, measures in DAX, transformations in Power Query, a gateway for the database in their own server room, and a Pro license for every person who opens the report on a Monday.
Then the controller asks for the same numbers as a printed customer statement, and the answer is a second tool, Report Builder, and a second skill set. The person who knows the business does not build the report. They wait for it.
“refreshes taking anywhere from 45 minutes to 2 hours and failing multiple times a week”
“you end up chasing data across half the system”
The database is the model.
Tau reads SQL Server, PostgreSQL, MySQL, Oracle, Snowflake, BigQuery, and the rest directly with one read-only login. For a cloud ERP that does not expose its database, such as NetSuite or Business Central online, Tau keeps an up-to-date copy beside the reporting engine, refreshed every minute, and runs every report on that copy.
There is no model to build first. Every report is a query the assistant writes from a question like open orders by rep with backordered lines flagged, and the person who knows the data reviews it. The same query drives the dashboard and the printed report with bands, group totals, and page N of M, designed in the browser and delivered on a schedule.
Runs on your server. Windows, Linux, or a container. Nothing leaves your network unless you schedule a delivery, and nobody needs a viewer license.
Tau and Power BI, for ERP and database reporting.
This table is about reporting on a business system. Power BI does more than that, and the next section says when to stay with it.
| What you need | With Power BI | With Tau |
|---|---|---|
| Getting to the data | A connector per source, a gateway for anything inside your network, and a model built in Power BI Desktop. | A read-only login. Databases are read directly. Cloud ERPs are copied beside the engine and refreshed every minute. |
| Building a report | Power Query for the transformations, DAX for the measures, relationships, then the visuals. | Ask a question. The assistant writes a query you can read and change, then drafts the report. |
| Printed and paginated reports | A second tool, Power BI Report Builder, with its own layout model and skill set. | Bands, groups, running totals, subreports, and page N of M, designed next to the dashboards. |
| Scheduled delivery | Subscriptions send a PDF to a list. One file per customer needs data-driven subscriptions on capacity, or Power Automate. | Scheduled PDF or Excel to a list, or one file per customer, rep, or location, with a delivery log. |
| Data freshness | Import mode refreshes on a schedule with a daily cap. DirectQuery is live but slow on wide ERP tables. | Databases are read live when a report opens. Cloud ERP copies refresh every minute. |
| Who can open a report | Everyone who views needs a Pro or Premium per-user license, unless you buy a large Fabric capacity. | Anyone with a login. Access is set per space, group, and report. |
| Excel | Export the data behind a visual, without the layout, or Analyze in Excel against the model. | Excel delivery that keeps the layout, with live formulas in the totals. |
| Where it runs | Microsoft's cloud. Your data leaves your network to be modelled and served. | Your server, on Windows or Linux, or a container. Reports are plain files with version history. |
| Cross-system reports | Possible, once each source is modelled and related in the same dataset. | One report across the ERP, the warehouse system, and the system you are migrating from. |
When you should stay with Power BI.
Power BI is the better fit in these situations, and we will tell you so on a call.
You are invested in Fabric
If your data already lives in OneLake or a Fabric lakehouse with engineers who maintain it, Power BI is the natural front end.
You have DAX skills in-house
A team that already maintains a good semantic model has paid the cost Tau avoids. Keep the model and add Tau for the printed and scheduled reports.
You need the wider ecosystem
AppSource visuals, deep Teams and Excel integration, and Copilot on Fabric are Power BI strengths. Tau has a smaller set of visuals aimed at operational reporting.
Your sources are not databases
Dozens of SaaS tools and spreadsheets with no database behind them favour Power BI's connector library. Tau is strongest on a database or an ERP it can copy.
A Power BI alternative for the system you run.
Each guide covers how Power BI reaches that system and how Tau connects instead.
Business Central
The Power BI connector reads Business Central in small pages and refreshes on a schedule. Tau keeps a copy refreshed every minute and prints the statement too.
Business Central and Power BI →SQL Server
No gateway, no import, no refresh window. Tau reads SQL Server directly with a read-only login and prints from the same query.
SQL Server and Power BI →Dynamics 365 Finance
Power BI over a data platform is a project. Tau reads the database you already export to.
Dynamics 365 Finance and Power BI →Acumatica
Power BI reads Acumatica through OData feeds over generic inquiries. Tau reads the database directly, or copies the inquiries you publish.
Acumatica and Power BI →What carries over, and what does not.
What carries over. The questions your reports answer, the SQL views behind your datasets, and the definitions your team has agreed on. Tau reads the same views.
What does not. DAX measures, Power Query steps, and PBIX files. The assistant rebuilds those as queries from each measure's plain-English description. Row-level security becomes Tau spaces, groups, and per-report permissions.
How teams do it. Start with the reports people are still waiting for: the printed pack, the statement per customer, the Monday PDF. Power BI keeps running beside Tau for as long as it is useful.
Tau as a Power BI alternative: the questions we get asked.
Is Tau a replacement for Power BI?
For reporting on an ERP, an accounting system, or a SQL Server database, yes: dashboards, printed reports, matrices, and scheduled delivery from one tool. It is not a replacement for the wider Fabric platform or for data science work.
Can we keep Power BI and use Tau as well?
Yes. Many teams keep Power BI for company-wide analysis and use Tau for operational reporting on the ERP: the printed pack, the statement per customer, and the Monday PDF.
Bring one report you built in Power BI.
Tell us which system it reads and what it took to build. We will rebuild it in Tau with you, live, and print it.